Search Research Library:
Research Library
Publication
The Electricity of Touch: Detection and Measurement of Cardiac Energy Exchange Between People
Table of Contents:
4. Experimental Examples
Example 1: Holding Hands
The purpose of these experiments was to test the hypothesis that when 2 people touch, an exchange of electrical energy produced by their hearts occurs. In the experiments reported on here, 6 subjects were paired in groups of 2. Each pair was monitored on a separate day. The experiment was designed to test for the appearance of the source’s ECG signal in the receiver’s EEG recording when the subjects were sitting several feet apart and when they held hands but made no other contact. Data were also analyzed to check for the transfer of energy in the reverse direction. The subjects were seated and fitted with ECG and EEG electrodes. The EEG electrodes were attached to the CZ, C3 and C4 locations on both subjects. The reference for both the C3 and C4 electrode was at the CZ location. The 2 subjects were simultaneously monitored using a 10-minute baseline period during which they were separated by 4 feet, followed by a 5-minute hand holding period. In this experiment subjects were instructed to hold hands and were not instructed to have any specific intention or feeling state. Signal averaging was used to detect the appearance of the source’s ECG signal in the receiver’s signal-averaged waveform (SAW) at the various electrode locations. The SAW in the receiver was triggered by the R-wave (250 ECG cycles) of the source’s ECG.
Results
When the subjects were seated 4 feet apart, there was no indication of a transfer of energy between them from the 250 averages used in these experiments. However, when they held hands, the source’s ECG could be clearly detected in the receiver’s SAW at both the C4 and C3 locations.
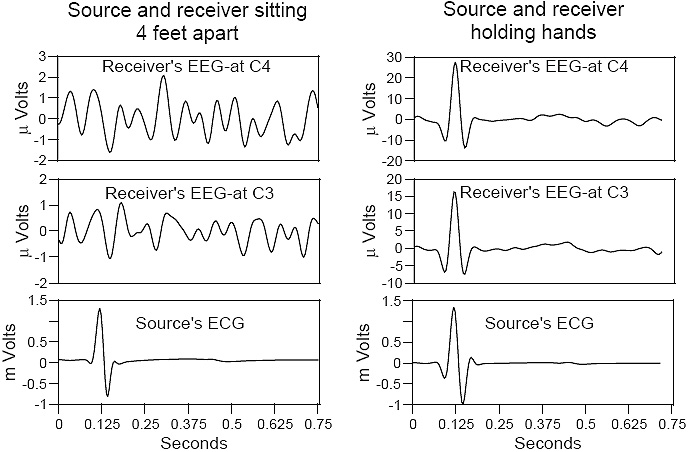
Figure 4.
Cardiac signal averaged waveforms before and while holding hands.
Signal averaged waveforms showing a transference of theelectrical energy generated by the source’s heart to the receiving subject’s head. The baseline recording (lefthand column) was from a10-minute period during which the subjects were seated 4 feet apart. The righthand column of panels shows the recording from a 5-minute period during which the subjects held hands. The EEG electrodes on the receiver were placed at the C3 and C4 locations.
Figure 4 above shows the data from one set of subjects. In this particular subject pair, we were not able to detect an energy transfer in the reverse direction (i.e. the receiver’s ECG did not appear in the source’s SAW). In all 3 sets of subjects, the ECG of one of the subjects was easily detected in the other’s SAW. However, in only one set of these 3 experiments were we able simultaneously to see the effect in both directions. The data were also analyzed to see if the ECG of the source was synchronized with the receiver’s ECG. It was determined that there was no synchronization between the two ECGs, thus confirming that the ECG signal appearing in the receiver’s recordings was indeed transmitted from the source’s heart rather than the receiver’s own. This was true in all the experimental examples which follow.
Example 2: Hand Holding Orientation
This experiment was designed to determine whether the transfer of cardiac energy, as observed in Example 1, would be affected by changes in the orientation of the subjects’ hand holding (i.e. source’s left hand holding receiver’s right hand vs source’s right hand holding receiver’s left hand, etc.). Subjects were seated and fitted with ECG and EEG electrodes. Electrode placement was the same as in Example 1, with the exception that the EEG electrodes were referenced to linked ears. The subjects held hands for 5 minutes in each of the four possible orientations (source’s left hand holding receiver’s left hand; source’s right hand holding receiver’s left hand; source’s left hand holding receiver’s right hand; source’s right hand holding receiver’s right hand). The recordings were analyzed as in Example 1.
Results
In the four different hand holding orientations tested, measurable differences were observed in the transfer of cardiac energy between subjects, as measured by the amplitude of the source’s ECG signal appearing in the receiver’s EEG recording. As seen in Figure 5 below, the source’s ECG appeared with the largest amplitude in the receiver’s SAW at the CZ location when the receiver’s right hand was held by either the source’s left or right hand (top right and bottom right panels). When the receiver’s left hand was held by the source’s right hand, the source’s ECG was could still be detected in the receiver’s SAW, but at a somewhat lower amplitude. Finally, when the receiver’s left hand was held by the source’s left hand, the source’s ECG signal was not detected in the receiver’s SAW.
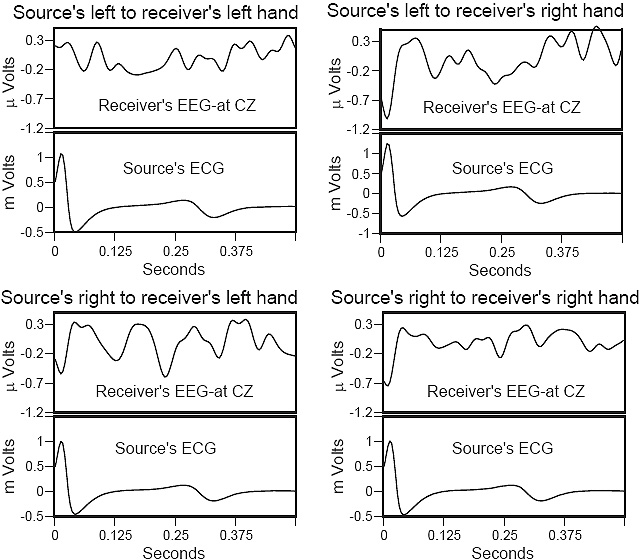
Figure 5.
Cardiac signal averaged waveforms with different hand holding orientations.
Signal averaged waveforms showing differences inthe transference of the electrical energy generated by the source’s heart to the receiving subject’s head depending on which hand holdingorientation was adopted. Subjects held hands for 5 minutes in each of the four orientations shown. Data shown are from the CZ locationon the receiver.
Example 3: Wearing Glove
This experiment was designed to see if the source’s ECG could be picked up on the receiver’s arms and to determine whether the signal was being transferred by means of electrical conduction or by radiation. Electrodes were placed 8 inches apart on the reciever’s right upper arm and in the standard locations for ECG measurement on both subjects. Once a 5-minute baseline period was recorded, the subjects joined hands and recording continued for the next 5 minutes. The experiment was then repeated with the source wearing a form-fitting full-length latex lab glove.
Results
The lefthand panel in Figure 6 below shows that the source’s ECG could be clearly detected on the receiver’s right arm when neither subject was wearing a glove. The righthand panel depicts the results when the source was wearing the latex glove. In this case, the source’s ECG signal was still present in the receiver’s SAW; however it was approximately tenfold lower in signal strength.
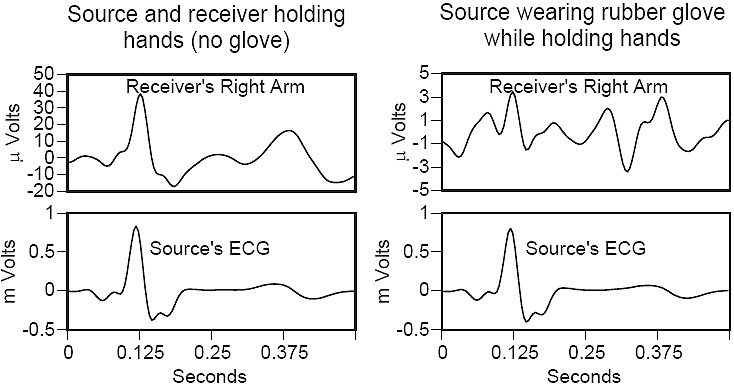
Figure 6.
Cardiac signal averaged waveforms: holding hands with and without glove.
Illustrates the difference in signal strengthmeasured on the receiver’s arm with (righthand panels) andwithout (lefthand panels) the source wearing a latex glove whenthey held hands. Note that the source’s ECG signal is still presentin the receiver’s SAW when the glove is worn; however, itsamplitude is reduced by a factor of 10 (note scales).
Example 4: Light Touch
This purpose of this experiment was to determine whether the signal could be transferred by the source lightly touching the receiver’s body at different locations. In this experiment, the receiver was lying supine on a padded massage table while the source stood next to the table. Three separate trials were performed: In the first, the source lightly placed his right hand on the receiver’s forehead; in the second, he placed his right hand lightly on the receiver’s stomach; in the third trial, the source placed one hand on the receiver’s forehead and the other on his stomach. Electrodes were placed 4 inches apart on the receiver’s left and right lower arms and on the standard locations for ECG measurements on both subjects.
Results
In all three trials, the source’s ECG signal was clearly detectable in the receiver’s SAW on both arms; however, the signal measured across the receiver’s right arm was consistently 5 times greater in amplitude than the signal picked up on the left arm Figure 7 below; note scales).
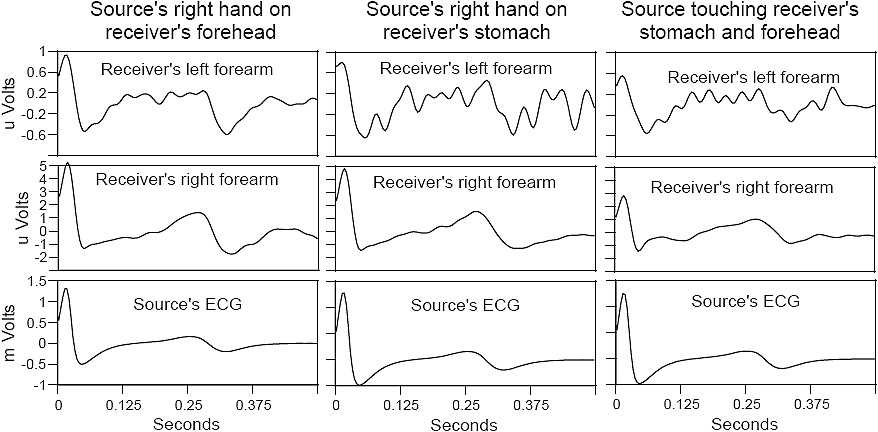
Figure 7.
Cardiac signal averaged waveforms: light touch.
Signal averaged waveforms showing the transference of the electrical energygenerated by the source’s heart to the receiving subject’s forearms when the source lightly touched the receiver’s forehead (lefthandpanels), the receiver’s stomach (middle panels), or both stomach and forehead (righthand panels).
Example 5: Wired Together
This experiment was designed to determine whether the cardiac energy transfer could be increased through forming a hard wire connection between the subjects. The subjects were seated side by side with 18 inches between them. After baseline recordings were established, 5 minutes of data were collected with the subjects wired together. A hard wire connection between subjects was created by placing ECG electrodes on the right side of each subject’s rib cage and connecting the electrodes with a 36-inch ECG lead wire. Electrodes were placed 4 inches apart on the receiver’s left and right lower arms, 2 inches apart on the receiver’s forehead and at the standard locations for ECG measurements on both subjects.
Results
The source’s ECG signal was detected in the receiver’s SAW on both arms and on his forehead; however, the amplitude of the transferred signal was not increased with respect to the hand holding or light touch experiments. Figure 8 below. As was also observed in the light touch experiments (Example 4), the signal measured across the receiver’s right forearm was approximately 5 times greater than that picked up on the left forearm.
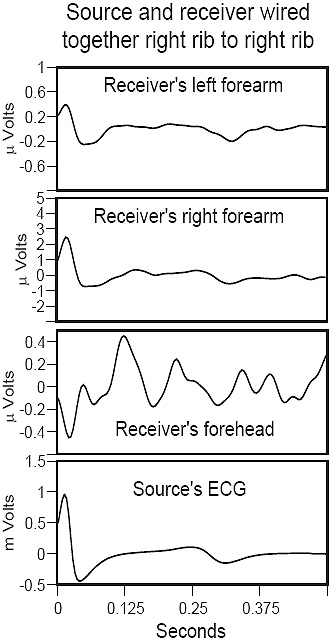
Figure 8.
Cardiac signal averaged waveforms: subjects wired together.
Signal averaged waveforms showing the transferenceof energy generated by the source’s heart to the receivingsubject’s forearms and forehead when subjects were wiredtogether right rib to right rib. No increase in the amplitude of thetransferred signal was observed with respect to the experimentsin which subjects held hands or touched lightly.
Example 6: Proximity without Contact
As the cardiac signal is known to be radiated outside the body, in this experiment we sought to determine whether the signal would be detected by the receiver when subjects were not touching. The subjects were seated side by side with 18 inches between them at the closest point. Electrodes were placed 4 inches apart on the receiver’s left and right lower arms and on the standard locations for ECG measurements on both subjects. Two thousand averages were used for this experiment (approximately 30 minutes recording time).
Results
Figure 9 below is an overlay plot showing the readings from the electrodes on the receiver’s arms and the source’s ECG. We were able to detect a signal on the receiver’s arms; however, there was a phase shift of 10 ms between the source’s ECG and the appearance of the signal across the electrodes on the receiver’s arms.
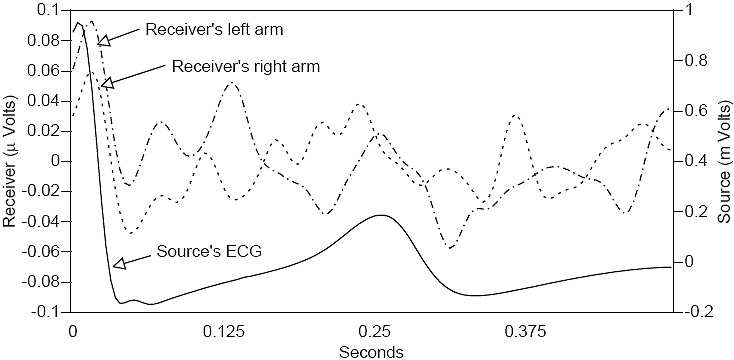
Figure 9.
Cardiac signal averaged waveforms: subjects in proximity without contact.
Overlay plot showing the signal averaged waveformsrecorded from the receiver’s arms and the source’s ECG when subjects were seated 18 inches apart without touching. Note that thesource’s ECG signal is detected in the receiver’s SAW on both arms, but is delayed by 10 milliseconds. Waveforms are the result of 2000 averages.

